ICEECE2012 Poster Presentations Adrenal cortex (113 abstracts)
Significance of ACTH stimulation test in the diagnosis of an aldosterone-producing adenoma
T. Sonoyama , M. Sone , K. Miyashita , N. Tamura , K. Yamahara , K. Park , N. Oyamada , D. Taura , M. Inuzuka , K. Kojima , K. Honda , Y. Fukunaga , N. Kanamoto , M. Miura , A. Yasoda , H. Arai , H. Itoh & K. Nakao
Kyoto University Graduate School of Medicine, Kyoto, Japan.
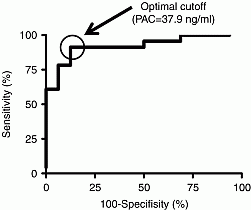
Primary aldosteronism (PA) is a major cause of secondary hypertension. Among PA, the diagnosis of an aldosterone-producing adenoma (APA) is critical because an APA can be cured surgically. Adrenal venous sampling (AVS) is the golden standard test in the diagnosis of an APA, but is available only in specialized medical centers. Meanwhile, aldosterone secretion of an APA is reported to be more sensitive to ACTH than that of idiopathic hyperaldosteronism (IHA) or essential hypertension. In this study, we evaluated the diagnostic accuracy of ACTH stimulation test with 1 mg dexamethasone suppression (dex-ACTH test) in the diagnosis of an APA among patients with suspected PA. Patients admitted to Kyoto University Hospital on suspicion of PA were included and were classified into three groups; non-PA group (n=20), IHA group (n=16), and APA group (n=23) by captopril challenge test and AVS. In dex-ACTH test, plasma aldosterone concentrations (PACs) were examined every 30 min after ACTH stimulation until 120 min. After ACTH stimulation, PACs increased in all the three groups. PACs in the APA group were significantly higher in patients than those in the non-PA group and the IHA group (Table). Receiver operated characteristics (ROC) curve analysis showed that the diagnostic accuracy of the dex-ACTH test for the diagnosis of the APA group from all the patients included was highest at 90 min after ACTH stimulation, with the optimal cutoff value of PAC >37.9 ng/dl, corresponding with sensitivity and specificity of 91.3 and 80.6% (Figure). Our study indicates that the dex-ACTH test is useful in the diagnosis of an APA among patients suspected of PA. Dex-ACTH test, which is available on an outpatient setting and does not require special technique or devices, can be used to select patients who are highly suspected of an APA and definitely require AVS.
| Before | 30 min | 60 min | 90 min | 120 min | |
| Non-PA group | 11.1±0.7 | 32.4±2.2 | 34.4±2.4 | 32.2±3.1 | 27.0±2.7 |
| IHA group | 11.6±0.9 | 33.0±2.4 | 34.6±2.8 | 31.9±2.8 | 27.8±2.8 |
| APA group | 17.1±2.9 | 64.7±8.5 | 80.1±13.1 | 75.2±8.8 | 62.6±6.9 |
| Data are means±S.E.M. (ng/dl) | |||||

Figure 1. The ROC curve of PAC at 90 minutes after ACTH stimulation for the diagnosis of the APA group
Declaration of interest: The authors declare that there is no conflict of interest that could be perceived as prejudicing the impartiality of the research project.
Funding: This work was supported, however funding details unavailable.
 }
}


