ICEECE2012 Poster Presentations Diabetes (248 abstracts)
What arises from the decrease of visceral adiposity in Japanese diabetic patients with visceral fat accumulation?
T Ohoshi 1 , Y Hiromine 2 , T Yamauchi 2 , Y Kishitani 3 , K Ogawa 4 , T Akamizu 5 & K Nanjo 6
1Hashimoto Municipal Hospital, Hashimoto, Japan; 2Kinki University School of Medicine, Osaka-Sayama, Japan; 3Nara Hospital Kinki University School of Medicine, Ikoma, Japan; 4Kihoku Hospital Wakayama Medical University, Ito-gun, Japan; 5Wakayama Medical University, Wakayama, Japan; 6Wakayama Rosai Hospital, Wakayama, Japan.
Aim: To clarify what arises from the decease of visceral adiposity in Japanese diabetic patients with visceral fat accumulation.
Patients: Diabetic patients (n=30) whose visceral fat areas (V), determined with abdominal CT, were larger than 100 cm2.
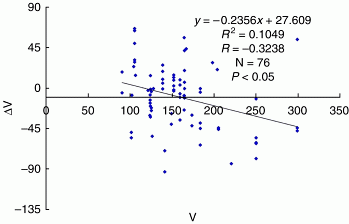
Methods: V was followed at every 6 month, and clinical profiles and course were compared of eight patients (group D), whose changes of V(ΔV=(V at the second exam or more)−(V at the first exam)) were under the (mean - S.D.) of ΔV, with of the other patients (group C).
Results: In group D, at the beginning V was larger, frequency of fatty liver and serum concentrations of TG and LDL-C were higher, insulin therapy was fewer, and fibrates were used more than in group C, during the following BMI was decreased, frequency of more than 5000 steps/day was increased, A1C (NGSP %) was decreased, and use of ACEI/ARB was increased, though diastolic pressure was decreased in group C, and at the ending serum TG was yet higher than in group C.
Discussion: As V was decreased, body weight was decreased and the metabolism of glucose and lipids were improved. Increase of ADL was important for decrease of visceral adiposity.
| Clinical parameter | Group | At the begining | At the ending | P 1 |
| V (cm2) | D (n=8) | 191±66 * | 128±70 | 0.000 |
| C (n=22) | 140±29 | 134±39 | 0.277 | |
| BMI | D | 27.3±4.2 | 26.2±4.2 | 0.015 |
| C | 27.9±3.4 | 27.8±3.5 | 0.696 | |
| A1C (NGSP%) | D | 8.2±2.2 | 6.6±0.6 | 0.039 |
| C | 7.2±1.3 | 7.2±1.4 | 0.818 | |
| Fatty liver | D | 6/8 * | 3/8 | 0.131 |
| C | 7/22 | 7/22 | 1.000 | |
| TG (mg/dl) | D | 427±456(8) * | 227±186(7) * | 0.140 |
| C | 146±107(20) | 128±64(22) | 0.416 | |
| LDL-C (mg/dl) | D | 144±15(8) * | 135±38(7) | 0.514 |
| C | 108±42(17) | 106±41(22) | 0.231 | |
| Times of counseling by dietitian 2) | D | 0.6±1.1 | 1.8±1.3 | 0.174 |
| C | 0.9±0.9 | 2.4±3.6 | 0.056 | |
| More than 5000 steps/day | D | 3/8 | 7/8 | 0.039 |
| C | 11/18 | 13/20 | 0.804 | |
| Mean±S.D.(n)/ratio 1) (at the beginning) vs (at the ending), statistically analysed with paired t-test/χ2 test 2) compared at the ending(during the following) with at the beginning(during the same length of period before following) *P<0.05 (D vs C), analysed with unpaired t-test/χ2. | ||||

Relationship between visceral fat area (V) and the change of V (ΔV). In y axis, the crossing level with x axis shows the mean of ΔV, and the level of −45 is the (mean-S.D.) of ΔV.
Declaration of interest: The authors declare that there is no conflict of interest that could be perceived as prejudicing the impartiality of the research project.
Funding: This research did not receive any specific gant from any funding agency in the public, commercial or not-for-profit sector.
 }
}


