EYES2019 7th ESE Young Endocrinologists and Scientists (EYES) Meeting Poster Presentations (46 abstracts)
Calcium infusion test in primary hyperparathyroidism- sensitivity of calcium sensing receptor, possible new theories?
Emir Muzurovic 1 , Sandra Pekic 2 , Marina Djurovic 2 , Dragana Miljic 2 , Marko Stojanovic 2 , Mirjana Doknic 2 , Zvezdana Jemuovic 2 , Snežana Vujošević 1 , Benida Šahmanović 1 & Milan Petakov 2
1Department of Endocrinology, Clinical Center of Montenegro, Medical school University of Montenegro, Podgorica, Montenegro; 2Clinic for Endocrinology, Diabetes and Diseases of Metabolism, University Clinical Center, Belgrade, Serbia.
Objective: Ionized calcium via calcium sensing receptors (CaSR) mediates feedback inhibition of parat hormone (PTH) secretion. The aim of this study is to evaluate the difference in PTH response during calcium infusion test (CIT), between patients with primary hyperparathyroidism (PHPT) and healthy control (HC).
Methods: Study consisted of 15 patients with confirmed PHPT and parathyroid adenoma (57.20±11.38yrs) and 15 healthy subjects-HC (57.20±11.41yrs) matched for age and gender. In all subjects, basal levels serum calcium, ionized calcium and PTH levels were measured before, during and after CIT (−30, 0, 1, 2, 3, 5, 8, 10 min). Statistical analysis included Spearman correlation, Student T-test.
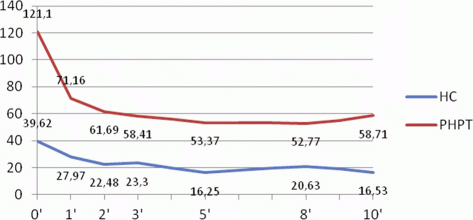
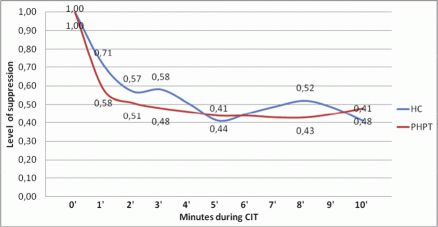
Results: Before CIT, basal PTH levels were 121.1±92.06 ng/l (PHPT) and 39.62±12.73 ng/l (HC) (P<0.01). During CIT, PTH level is suppressed to a minimum mean value 52.77±42.04 ng/l (56.4%) in PHPT and 16.25±4.72 ng/l (58.9%) in HC group. Reduction of PTH levels is more pronounced in the PHPT group in the first minute of the test compared to the HC group (42% vs. 30%), in order to get closer in 5. minute of CIT. Average PTH nadir was measured in PHPT group in 8. minute, while in HC group was measured in 5. minute of CIT.
Conclusion: In parathyroid adenomas, chief cells retain the similar ability to suppress secretion of PTH during increase of Ca2+, as well as healthy, without differences in suppression levels. The main components of this process are related to the function of CaSR and the influence of vitamin D on the PTH-Ca2+ set-point.

Chart 1 PTH response (mean PTH values, ng/l) during CIT (minutes) in PHPT and HC groups.

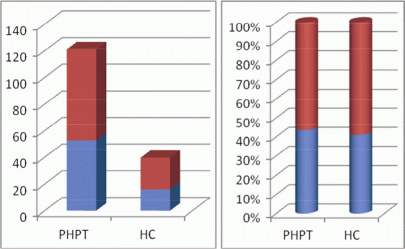
Chart 2 (left) i 3(right). PTH suppression- apsolute PTH values (left) and percentage of suppression (%) (right) during CIT

Chart 3 Suppression of PTH during CIT in PHPT and HC groups


 }
}


